Flatgeobuf
I recently came across Flatgeobuf and it looks like a really neat project. An Observable Notebook by its creator shows an example of progressively rendering polygons for all counties in the US and it got me thinking about how to apply it elsewhere.
The key of that demo — and something that takes advantage of how the Flatgeobuf format is designed — is the ReadableStream. Instead of having to read the entire file (14.1MB in the above demo) before starting to render our map, we can begin rendering essentially as soon as the first feature is read over the stream and continue rendering, feature-by-feature, as more features are loaded.
That’s accomplished with the following async code:
const response = await fetch('https://flatgeobuf.org/test/data/UScounties.fgb')

for await (let feature of flatgeobuf.deserialize(response.body)) {
  // Do stuff with `feature` here
}
The above snippet relies on your browser’s support for streaming which is surprisingly a sorta new thing. Streams have been around in non-web programming languages for ages and even Node.js made them a key language feature but support in browsers more or less just landed and I somehow missed it.
All of this got me thinking about a problem we ran into at $DAYJOB where we wanted to be able to show hundreds of thousands of points on a 2D map or 3D globe, all on the client-side. Since our data doesn’t change very often, we could just build custom 2D/3D tiles and send those but I wondered how fast doing this with a Flatgeobuf would be.
To test this out, I wrote a small Python scripts to generate a GeoJSON FeatureCollection of a million random points:
from collections import OrderedDict
import json
from numpy.random import default_rng

rng = default_rng()

n = 1000000
lons = rng.uniform(-180, 180, n)
lats = rng.uniform(-90, 90, n)
pairs = zip(lons, lats)

def create_feature(lon, lat):
    return {
        "type": "Feature",
        "properties": OrderedDict(),
        "geometry": {"type": "Point", "coordinates": (lon, lat)},
    }

features = [create_feature(pair[0], pair[1]) for pair in pairs]

geodata = {
    "type": "FeatureCollection",
    "features": features,
}

with open("./output.geojson", "w") as f:
    f.write(json.dumps(geodata))
And then ran that through ogr2ogr to generate a Flatgeobuf file:
ogr2ogr -f FlatGeobuf output.fgb output.geojson
While Flatgeobuf may be new to me, it seems like it already has pretty broad support in tools such as GDAL, Fiona, QGIS, and more.
The above ogr2ogr command created a 106.7MB Flatgeobuf file.
I slapped together a quick demo using JS similar to the above but swapped out d3 for the Canvas API and promptly ran into my first hiccup with the format: My points didn’t start drawing until about 40MB of the file were streamed which is not what I was going for.
I asked about this on the developers’ Discord and they quickly set me straight: Flatgeobuf’s index is stored at the beginning of the file and uses about 40 bytes per node. So for my 1,000,000 points, roughly 40MB is just for the index.
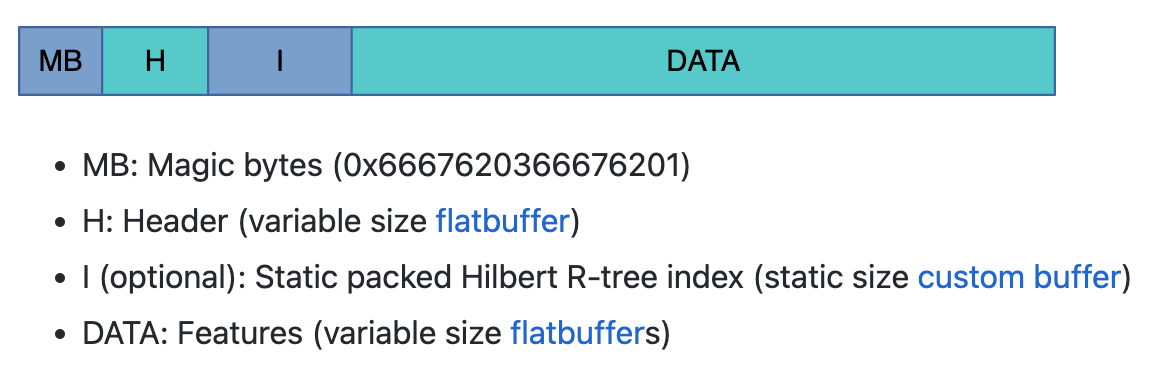
Since my demo didn’t need the spatial index (I didn’t need to subset by a bounding box, which is another feature of the format), I could omit the index by passing the -lco SPATIAL_INDEX=NO flag to ogr2ogr:
ogr2ogr -f FlatGeobuf -lco SPATIAL_INDEX=NO output.fgb output.geojson
The resulting file ended up coming in at 64MB which matches the above estimate. The impact of not having the index is that drawing happens in the same order as the features were written out in the GeoJSON file, rather than following a Hilbert R-Tree For my use case, this is totally fine.
With this smaller, index-less file, the drawing begins immediately. And on my 10Mbit home connection, it actually takes about 20 seconds to stream which is (accidentally) a great way to showcase how well this works:

Check out the demo for yourself at https://amoeba-flatgeobuf-experiments.netlify.app or check out the code. The demo only really works on Chrome, probably due to differences in Canvas API implementations. Safari seems to delay doing any painting until all draw commands are done and Firefox seems to batch them.